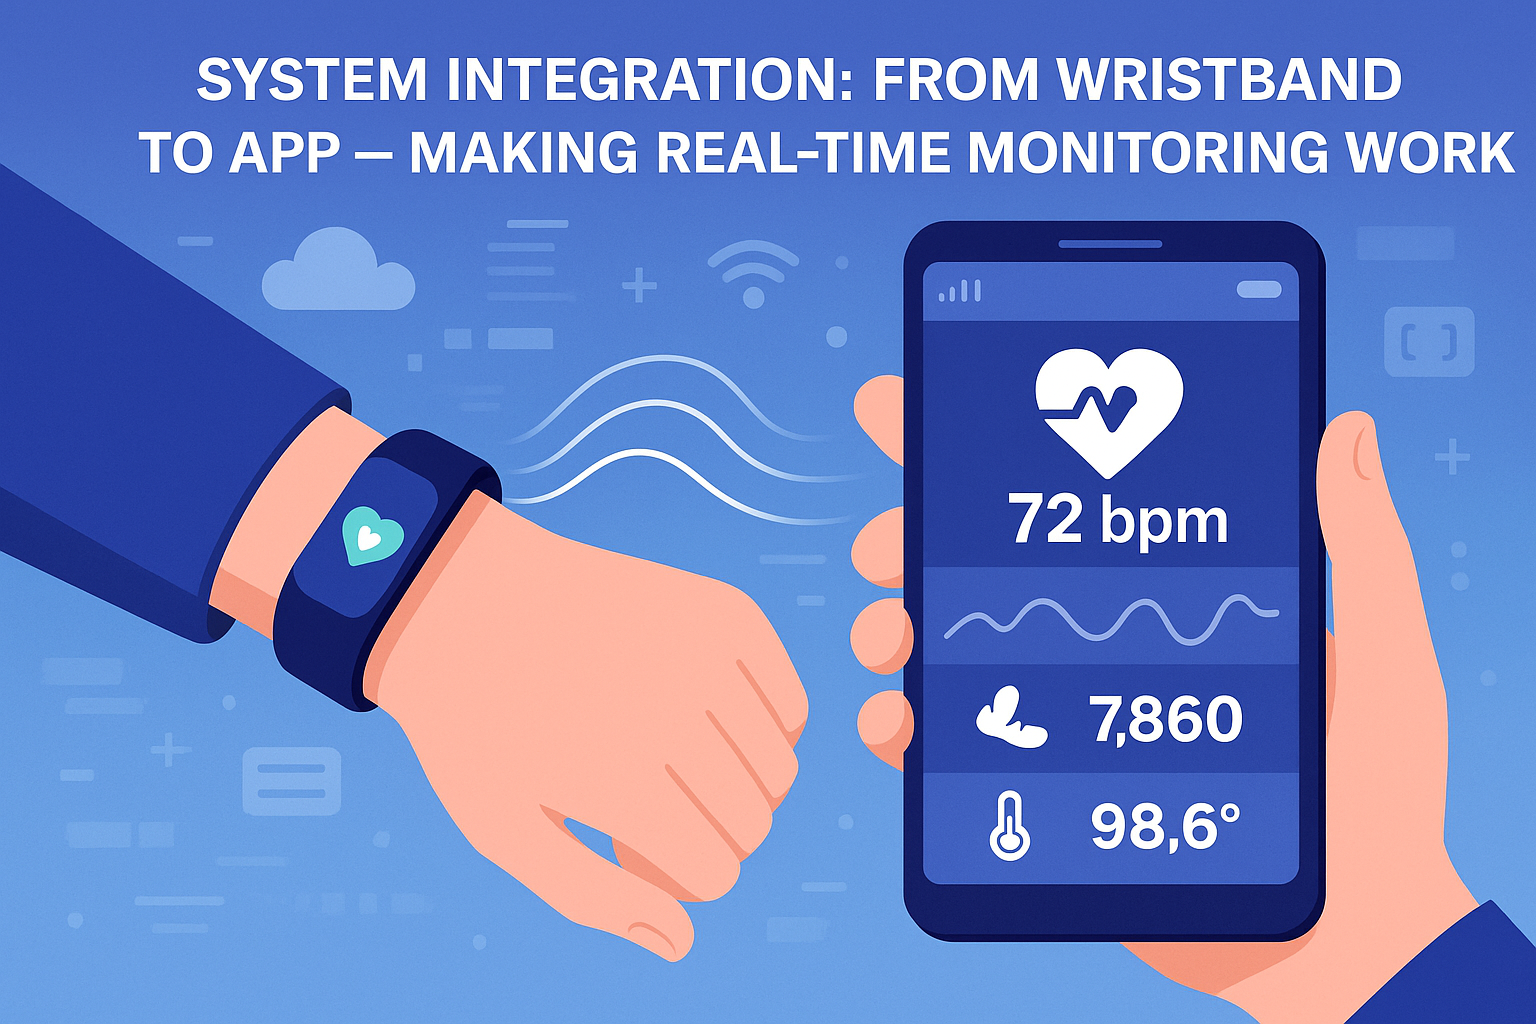
As our project evolves into a fully functional system, one of the most critical aspects we’ve tackled is system interconnection. With multiple components working together — from wearable sensors to cloud databases and mobile interfaces — ensuring seamless communication and data integrity is essential.
In this post, we’ll walk through how we’re connecting every layer of the architecture to turn raw sensor data into actionable information for healthcare professionals.
System Overview
The Dynamic Emergency Monitoring System (DEMS) is built to collect vital sign data from patient wristbands and deliver that information to a centralized application interface in real time. This process involves multiple stages and technologies working in sync:
- 1. Wearable Device (Sensor Layer)
- 2. Edge Computing Node (Laptop or Raspberry Pi)
- 3. TCP/IP Server for Data Acquisition
- 4. CSV Data Logging
- 5. Python Backend Processing
- 6. MongoDB Cloud Database
- 7. Mobile/Web App Interface
Step 1: Sensor Data Acquisition via TCP/IP Server
The wearable wristbands, equipped with sensors like the MAX30102 and MLX90614, communicate with a Laptop that acts as a local edge device. We designed a lightweight TCP/IP server on the Laptop to:
- Listen for data packets from the wearable via Bluetooth or serial.
- Handle incoming connections and ensure that data is correctly received.
- Maintain continuous real-time streaming of vital signs such as heart rate, SpO₂, and temperature.
The TCP/IP protocol was chosen for its reliability and wide support in real-time applications.
Note: Although we have a Raspberry Pi to host the server, due to the conditions under which we needed to test the prototype, we opted to use our laptop for better portability. Nevertheless, all the programs are designed to be quickly configurable, allowing for minimal setup time.
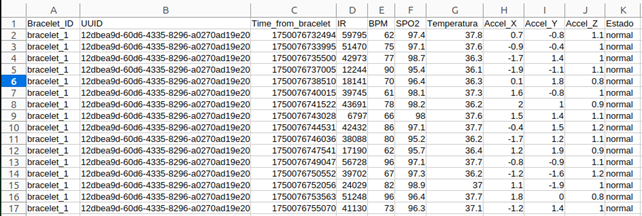
Step 2: CSV File Generation
Once the server host receives the data, it temporarily stores it by writing it to a CSV (Comma-Separated Values) file. This intermediate step allows us to:
- Log the incoming sensor data with timestamps.
- Create a backup in case of system failures or dropped network connections.
- Use this file as a source for debugging and historical data analys is.
Step 3: Python Backend Processing & Database Insertion
To bridge the gap between raw data and our app, we developed a Python application that continuously reads and processes data from the CSV file. This application:
- Cleans and formats data into structured records.
- Performs initial validations (e.g., range checks, missing values).
- Adds any metadata required (e.g., patient ID, triage color, timestamp).
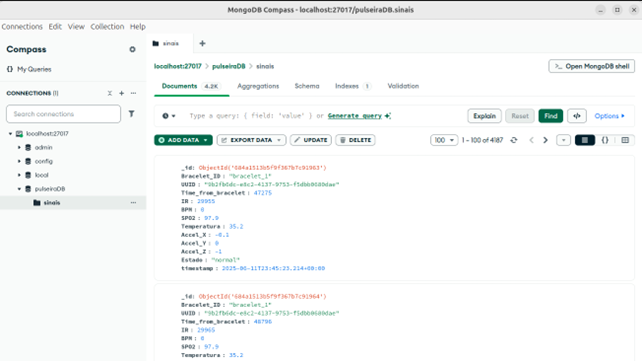
- Uploads the data to MongoDB, our cloud-based NoSQL database.
MongoDB is ideal here due to its flexibility in handling semi-structured data and ability to scale with multiple concurrent inputs, with minimal configuration required to get started.
Step 4: Making Data Available to the App Interface
Once the processed data is in MongoDB, it becomes accessible to the frontend application via API calls. This ensures:
- Real-time visualization of patient data.
- Access to historical logs and trend graphs.
- Alerts and notifications based on triage priority or threshold breaches.
Our app queries the MongoDB database through a RESTful API, which ensures modularity and clean separation between the backend logic and the frontend interface.
Why This Architecture?
We’ve chosen this layered approach for several reasons:
- Reliability: If cloud connectivity drops, the edge node (Raspberry Pi) can still store data locally.
- Modularity: Each layer (sensor, edge, backend, database, app) can be tested and improved independently.
- Scalability: Multiple hosts can handle data from different wristbands simultaneously and feed into the same system.
- Traceability: The CSV file acts as a transparent log of all collected data, making debugging much easier.